The dashboards I refused to build
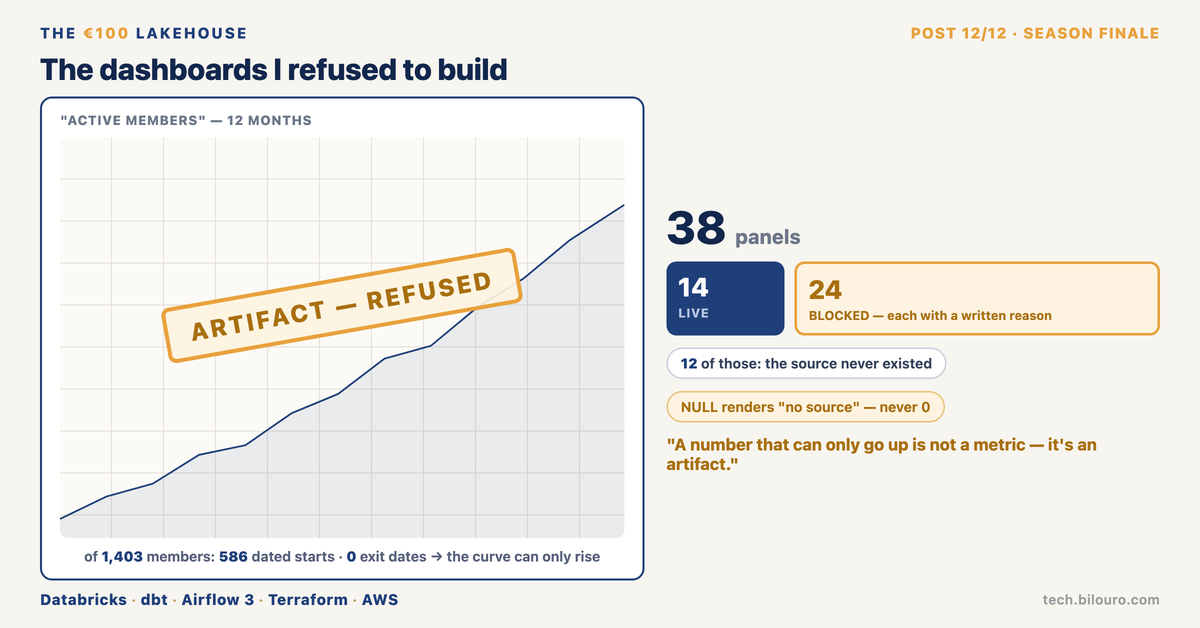
1,403 members. 586 have a dated start. Zero have an exit date. A 12-month "active members" curve over that can only rise — so I refused to draw it.
The €100 Lakehouse — 12/12
1,403 members. 586 have a dated start. Zero have an exit date. A 12-month "active members" curve over that can only rise — so I refused to draw it.
A flawless growth curve — a migration artifact — on the tab the owner reads to judge health. A reload brought 74 dated exits: actives dropped 586 → 549. Honest content, not a defect.
The refusals live in code — a MISSING dict, every absent card with its reason: "a chart that looks like the operator's and means something else is worse than no chart."
→ The P&L refuses the 100% margin it would read with costs at zero. 7 of 13 lines computed; the rest render "no source" — what a NULL renders.
→ Revenue is one line, "all studios" — a split would be an allocation rendered as a measurement. A test asserts that exact series; when studios are attributable, it fails on purpose.
38 panels: 14 live, 24 blocked with a written reason — 12 because the source never existed.
I wrote the decision log, the GDPR rulings, every cost trade-off. AI agents executed inside a control system — gates, adversarial verification, evidence requirements. 88 of 91 commits carry the co-author line.
Post 1/12 named the axis. The pilot tenant proved the isolation model; tenant #2 is a template clone, not a build.
A number that can only go up is not a metric. It's an artifact.
What's a dashboard you refused to ship — and did anyone thank you for the empty space?
Databricks · dbt · Airflow · Terraform · AWS
P.S. New tech post every Wednesday.
#100EuroLakehouse #AnalyticsEngineering #EngineeringCulture
Comments